How to Assess the Quality of Purchased Traffic When Visits Don't Generate Leads
First, define what action counts as a lead
A visit by itself doesn't show the quality of a purchase. For a services page, a lead can be a submitted form, a message in a messenger, a click on a contact, a consultation booking, or a payment. For a streaming channel, important actions can be a subscription, joining a community, clicking through to a stream, and returning for future broadcasts.
A source can only be evaluated against a pre-defined target action. If you only count forms but part of the audience writes in direct messages, your statistics will understate the result. If you count any button click as a lead, the numbers may look better than the actual number of inquiries.
The downside of this approach is that some actions have to be tracked manually: for example, conversations in messengers or inquiries that mention the placement.
Separate each purchase with its own link
For each service, channel, post, blogger, or ad creative, use a separate link with tags. The tags should distinguish the platform, placement format, specific campaign, and test date. That way you can see not just the overall flow of clicks but the result of a specific purchase.
- Don't put the same link in multiple placements.
- Change the campaign ID when you make a repeat purchase.
- Keep a table: link, launch date, source, promised volume, and cost.
- Set up goals for forms, contact clicks, and messenger transitions.
The downside of tags is that they don't fix traffic or identify bots automatically. If a purchase has already run through a shared link, you usually can't cleanly separate it from other sources.
Compare behavior by source, not visits
Open the report for your tagged sources and compare page depth, engagement time, transitions to internal pages, contact clicks, and target actions. A source with fewer clicks can be more valuable than a mass purchase if its visitors read the terms, view case studies, and start a conversation.
A single metric doesn't prove a problem. A high bounce rate can be caused by a slow page, a poor first screen, or the visitor immediately finding the information they needed. But a combination of bounces, short sessions, and no actions at all after the click already warrants investigation.
The downside of behavioral metrics is that they depend on your analytics settings and the landing page format. A single-page landing won't show page depth like a multi-page site.
Which metrics to consider suspicious
There's no single normal bounce rate: it depends on the source, device, page, and goal. But for an initial check, you can use a working threshold. For example, if a specific purchase has more than 80% of visits ending without an event, and most sessions last only a few seconds, that flow deserves a separate look.
Compare not against an abstract norm but against your other sources in the same period. If a niche channel brings visitors who navigate to services and contacts, while purchased traffic almost entirely closes the page immediately, the problem may be in the quality of the audience or how it was attracted.
The downside of thresholds is that they help you spot an anomaly but don't establish its cause. You can't automatically declare all traffic to be bots based on them.
Check geography, language, and timing of clicks
Real people can also be off-target. A Russian-language channel or services page gets little value from mass clicks from regions where people don't understand the content language, don't use the relevant platforms, or can't take advantage of the offer. Such users may open the link but won't leave a meaningful lead.
- Match countries and cities against your target audience.
- Check browser language if it's available in reports.
- Compare click times against publication times and audience activity.
- Check the ratio of mobile to desktop sessions.
Geography isn't direct proof of fraud: some people use VPNs, travel, or view content from another country. The downside of this method is that without additional signs, you can mistakenly flag a normal audience as low-quality.
Distinguish off-target audiences from bots
Empty traffic isn't always automated. A vendor may bring live users from entertainment publics, paid-task groups, random recommendations, or ads promising something the landing page doesn't offer. Such visitors may scroll the page and even click buttons, but they aren't interested in the service or channel.
Bots and automated clicks usually leave a more technical trace: repeating device parameters, identical session scenarios, unnatural request frequency, and no normal interaction with the page. Off-target live audiences behave more diversely but don't match your offer.
This distinction matters when making a claim to the supplier. Off-target traffic points to a wrongly chosen source or creative. Signs of automation give grounds to demand a separate quality check of the visits.
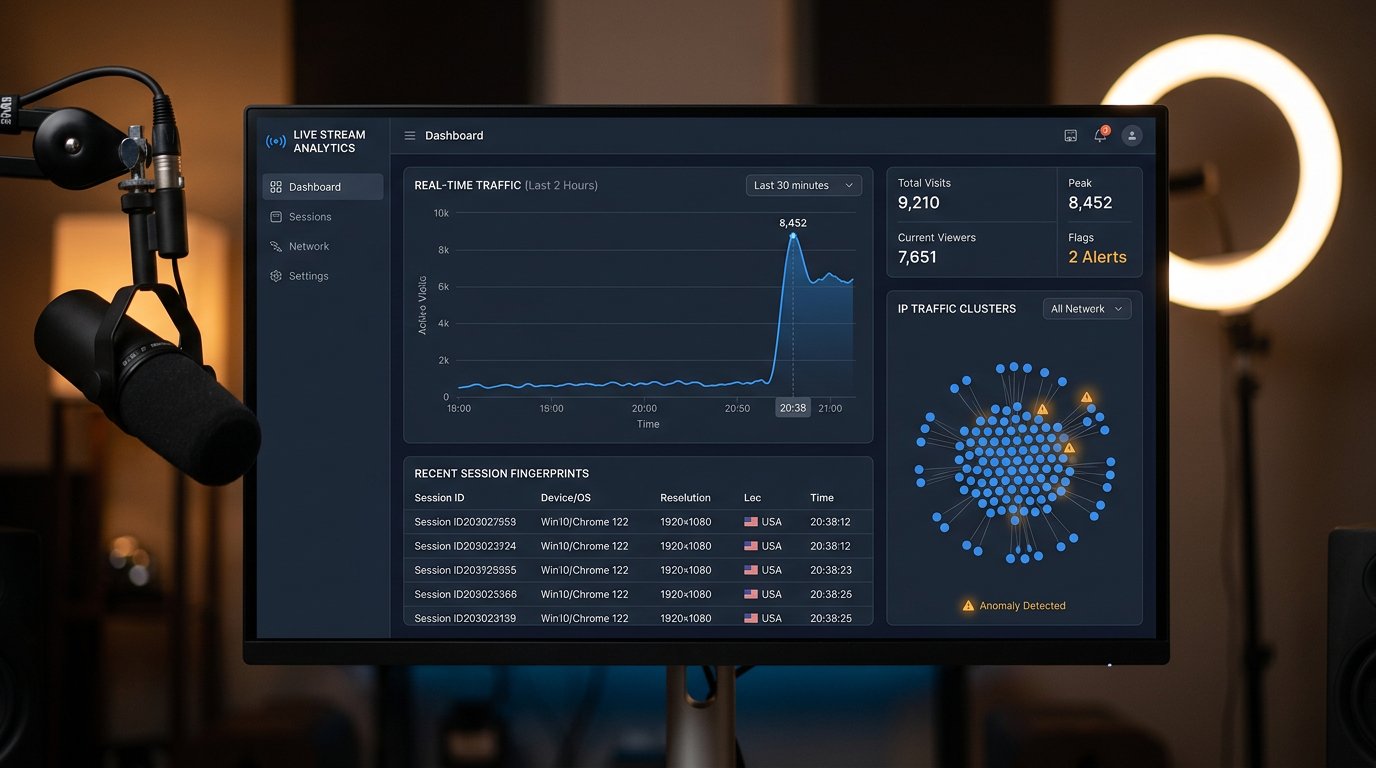
Check User-Agent and technical session parameters
User-Agent conveys information about the browser, operating system, and device. In analytics reports, site logs, or an anti-bot filter, look for empty, outdated, rare, or identical User-Agents that repeat across a large number of visits. It's suspicious when a flow of supposedly different users arrives with a single set of technical parameters.
Also compare screen resolutions, browser language, OS version, device type, and the presence of standard events: scrolling, clicks, page navigation. An identical set of signs proves nothing on its own, but combined with short visits and no leads, it becomes significant.
The downside of checking User-Agent is that it can be spoofed. Also, regular users of the same platform often have similar browsers and devices.
Look for unnatural frequency and identical scenarios
Review the visit timeline. Automated traffic often creates sessions at equal intervals or a sharp spike in clicks that isn't tied to a publication, broadcast, or ad impression. A series of visits where each user opens one page, spends almost the same amount of time, and leaves without scrolling or clicking is a red flag.
- Check whether session durations repeat with minimal variance.
- Compare the page sequence of visitors from the same source.
- See whether spikes occur at night or during hours uncharacteristic for your audience.
- Note a large number of visits without interaction events.
The downside of this analysis is that some system checks, link previews, and technical scanners also create short sessions. They need to be separated from paid traffic by tags and launch time.
Check IP pools in logs or an anti-bot filter
If you have access to site logs, CDN data, or anti-bot protection, check the IP addresses and subnets of the source. Suspicion is raised by dozens of sessions from a single address, frequent address changes within a close pool, requests from data centers instead of user networks, and identical technical parameters across different IPs.
It's useful to cross-reference IP pools with time, User-Agent, and on-page actions. If several addresses create identical sessions seconds apart, that looks more like automation than simply a high volume of clicks. Save the export before contacting the supplier.
The downside of IP checks is that mobile carriers and corporate networks can put many real people behind a single address. Also, not all analytics systems show IP to the site owner.
Rule out landing page and form issues
Before making a claim against the source, test the path to a lead yourself. Open the link from a phone and a computer, check page loading, the form button, data submission, emails, CRM, and messenger links. If inquiries are supposed to arrive in direct messages, make sure the link goes to the right chat.
Compare the creative's content with the first screen of the page. If the post promises a selection, a bonus, or participation in an activity, but after clicking the user sees only an order form, some bounces will be caused not by traffic quality but by a mismatch in expectations.
The downside of test leads is that they can show up in reports as real conversions. They need to be marked and excluded from the purchase evaluation.
Gather evidence for replacement or refund
Save the order terms, source description, promises about geography and audience type, statistics screenshots, tag exports, and time-based reports. Separately record the anomalies: irrelevant regions, repeating User-Agents, identical session scenarios, IP pools, absence of target actions, and sharp spikes.
Demand a replacement or refund not based on a single zero in the leads column, but on the traffic not matching the order terms. Specify the period, campaign link, number of suspicious visits, and specific signs. If the supplier promised a targeted live audience but the check shows automated sessions or a different region, ask for a review, replacement of the problematic volume, or a refund within their rules.
The downside of a claim is that without documented terms and a separate tag, proving where the visits came from is harder. The supplier may reasonably point to problems with the creative or landing page.
Test new sources with small launches
Don't mix several unknown purchases into one period. Launch them separately: one tagged link, one offer, one landing page, and a fixed observation window. Don't change the price, creative, form, and source at the same time, otherwise you won't be able to tell what affected the result.
After the test, compare not only visits but also the quality of conversations, returns to the channel, subscriptions, contact transitions, and subsequent payments. A source with a small volume but normal audience behavior is usually safer to scale than a flow with unexplained spikes.
The downside of a small test is that there may not be enough data for a final conclusion. But it limits losses if the source brings an off-target audience or automated clicks.
What to record for each traffic purchase
Keep a purchase log with the date, supplier, link, placement format, geography, promised terms, and results. Add the number of visits, target actions, inquiries, confirmed leads, and signs of anomalies. Note streams, publications, contests, and other events that could have affected demand.
- Link and campaign tags.
- Source, format, and order terms.
- Visits, bounces, events, and inquiries.
- Geography, devices, User-Agent, and spike times.
- Lead quality and conversation outcome.
- Screenshots and exports for a possible claim.
The downside of a log is that it needs to be filled in regularly. Without consistent records, results from different purchases quickly blend together, and you won't be able to compare suppliers by audience quality.
Last Articles
What has changed in design and functionality We have updated the website to make working with it faster and more convenient. The main changes affect ..
Good afternoon, I've collected all the news during this time.: 1. The main news is that prices for twitch viewers have been greatly reduced, while Tw..
1. Use promo code "December2025" for a 15% discount for all our viewers2. We have reduced the base prices for our configurator and the most affordable..
Twitch services are working stably, so we are ready to cooperate with squads, resellers, service owners, bot owners, and many others.Individual te..
We have completely updated our Twitch viewer services, and they are now working stably. We only use high-quality IP addresses for the viewers.The ..
Hello everyone! Today, we are announcing a new feature—"Twitch Viewer Configurator". Now, you can customize any plan for your Twitch channel. Choo..
Greetings, I have compiled a guide for streamers, which will be very relevant at the moment. Now YouTube and twitch have disabled monetization from vi..
We have finally developed the APINow it will be more convenient for our partner sites to work with us.To update the maximum tariffs for YouTube, an up..
Due to the huge popularity of the partnership services and referral program, we have made a cooperation table. The essence is very simple: more live a..
Our Services for Streamers








Our Services for Content Creators